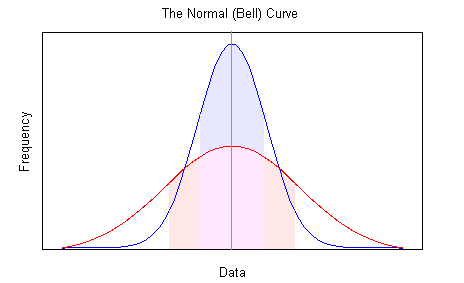
The standard deviation describes how spread out the results are about the mean. If the results are normally distributed 68% of them will be within a standard deviation of the mean.
A larger standard deviation (shown in light pink) indicates more scatter -- less precision -- in the results. A smaller standard deviation (shown in light blue) indicates less scatter. Both sets of results have the same mean (the green line).
The hard way to calculate the standard deviation of a set of numbers is with a calculator using this formula:
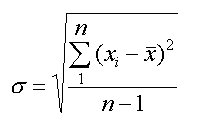 |
where: n = number of data points |
Many calculators have a built in standard deviation function. Most spreadsheets also include built in functions to do statistical analysis of data (check your spreadsheets help file for the term standard deviation or statistical analysis).
The following calculates the standard deviation of a set of numbers. To use it, enter your set of numbers, separated by spaces (i.e. 100.00 100.01 99.99 ....). When all the numbers are entered, press the [Calculate] button to display the mean and standard deviation.